Just what's going on in my life. For more about me, visit my website www.AnuragJain.com
Contact me
(Calls/SMS' welcome, but I won't reply to SMS')
# Yahoo Messenger
#
ajain@iimb.ernet.in
# anuragkjain
@yahoo.com
# +91-9886178995
(Online
24 hrs but may not be on machine all the time. You can be assured of a
response, though!)
Aviation Blogs
- Aviation India
- Devesh Agarwal
- Kapil Bhargava
Blogs I know
- AlbumOfTheMoment
- Alternative
Perspective
- Anand Sridharan
- Anuradha Goyal
- Anurag Gupta
- Aqua
- Desi Bridget Jones
- Dream Reem
- Emergic
- Gary
- Google Blog
- IS Research
- Oneirodynic
- Life in a HOV Lane
- Nirantar
- Pankaj Bagri
- PhDweblogs
- Prof Sadagopan
- Rajeev Sharma
- Radio Monitors
India
- RecordBrother
- Requiem for a
Dream
- Retail India
Business News
- Research Blogs
- Rojnamcha
- Scopitones
- Sling Inc.
- Slowread
- TheBuckStopsHere
- The Startup Journey
- VC Circle
- Venture Intelligence
IIMB Blogs
- Aadisht Khanna
- Amit Gandhi
- Aragorn (Nikhil
Gurjar)
- Deepak Devarajan
- Elysia
- IIM-B Thinks...
- Illusionaire (Kima)
- Gautam Srivastava
- Guhan
-
Manu Bharadwaj
- Meenakshi Shankar
- Nikhil Ramesh
- PGSM Blog
- Pradeep Shastry
- Sridhar Raman
- Sudheer Narayan
- Sumit Mittal
- Twisted Shout
(IIMB's Blog)
- Varathkanth
- Vinod ChikkaReddy
- Viswanathan RJ
RSS Feed:
1) Official Atom XML Feed
2) 
Powered by
RSSify at WCC
Archives
*October 2002
*November 2002
*December 2002
*January 2003
*February 2003
*April 2003
*May 2003
*June 2003
*July 2003
*August 2003
*September 2003
*October 2003
*November 2003
*December 2003
*March 2004
*April 2004
*May 2004
*June 2004
*July 2004
*August 2004
*September 2004
*October 2004
*November 2004
*December 2004
*January 2005
*February 2005
*March 2005
*April 2005
*May 2005
*June 2005
*July 2005
*August 2005
*September 2005
*October 2005
*November 2005
*December 2005
*January 2006
*February 2006
*May 2006
*June 2006
*July 2006
*August 2006
*September 2006
*October 2006
*November 2006
*December 2006
*January 2007
*February 2007
*March 2007
*April 2007
*May 2007
*June 2007
*July 2007
*August 2007
*September 2007
*October 2007
*April 2008
*May 2008
*June 2008
*July 2008
*August 2008
*September 2008
*October 2008
*November 2008
*December 2008
*January 2009
*February 2009
*August 2022
![]()
Blog Keywords:
Bangalore
IIM Bangalore
IIMB
Cultural Events
Management Education
Entrepreneurship
B-Schools
India
Sunday, May 29, 2005
Comments: Post a Comment
Hubbert's Peak: This is not a test run!
Some days back, I mentioned about the energy crisis. Time to write about it again.
The point of interest leading to both (last and this) posts is the Peak of Oil Production. There's a global and a regional Peak of Oil production, a limit beyond which the oil production will inevitably decline. Assuming the bell curve of oil production, the amount of time it took to reach the peak would also be the amount of time after the Peak time before which we run out of oil production. The phenomenon of Peak Oil Production was first noticed and estimated by US geoscientist Dr. M. King Hubbert, and hence the name Hubbert's Peak. (There was an article in Times of India recently explaining what it is.)
Now some factoids. Mainly taken from Dr Colin Campbell's year 2000 lecture. In 2000, oil industry expert Dr Colin Campbell lectured in Germany on the peak of world oil production. (Watch this very informative 1-hour lecture by Dr Colin Campbell on Peak Oil Production. Text version available here.)
# Some general Hydrocarbon stats:
. Conventional oil peaks around 2005
. All hydrocarbons around 2010
. Gas, less depleted than oil, peaks around 2020
. Gas liquids peak a little after gas, as extraction rates increase
. The decline after peak is about 3% a year
# World Oil Stats:
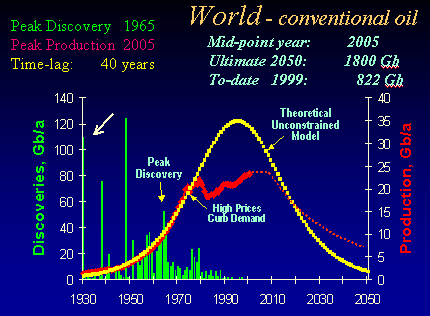
Produced: 822 Gb ~46% of Ultimate
Reserves: 827 Gb
Discovered: 1637 ~91% of Ultimate
Yet to find: 151
Yet to produce: 978
Ultimate: 1800
Production Rate: 22 Gb/year (rising)
Depletion Rate: 2.2% /year
Discovery Rate: 6 Gb/year (falling)
Discovery peaked in 1965. Production peaked in 2005. Time lag: 40 years. Mid-point year: 2005. Ulitmate 2050: 1800 Gb. To-date 1999: 822Gb

# USA
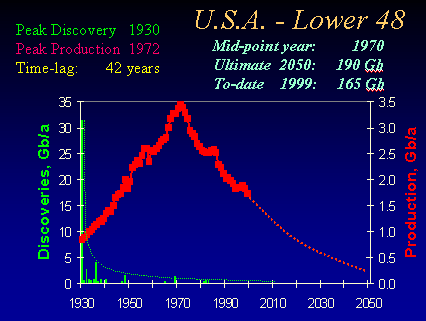
Discovery peaked in 1930
Production peaked in 1972
Time lag: 42 years
Mid-point year: 1970
Ulitmate 2050: 190 Gb
To-date 1999: 165Gb

#Middle-East

Dr Campbell also accuses Oil corporates of not playing it fair and he says it would be better to make a proper analysis of the true position and inform people (No one blames the government for an earthquake. So they would n't blame it for an oil crisis):
# British Petroleum certainly wins the prize for the most oblique reference to depletion when it changes its logo to a sunflower and says that BP stands for Beyond Petroleum. But its executives sit on the board of Goldman Sachs, the bankers. They should accordingly know what BP actually thinks behind the lace curtains of corporate make-believe. What do the bankers say? "The rig count over the last 12 years has reached bottom. This is not because of low oil price. The oil companies are not going to keep rigs employed to drill dry holes. They know it but are unable and unwilling to admit it. The great merger mania is nothing more than a scaling down of a dying industry in recognition of the fact that 90% of global conventional oil has already been found." - Goldmann Sachs, August 1999
# Shell says it in other words "There was a time when oil and gas reserves seemed endless..." - November 1999 Advertisement
Dr Campbell finishes his lecture with: "If you don't deal with reality, reality will deal with you".
How ominous!!
Comments: Post a Comment